
Lingual Phenotyping for Personalized Confection Design
Abstract
Human taste is not one sense but a set of receptor systems — sweet and umami through T1R receptors, bitter through the T2R family[1] — whose sensitivity varies from person to person, partly for genetic reasons[2,4]. Researchers now count the fungiform papillae on photographed tongues with automated and deep-learning methods[7,8,9,10]. We borrow that idea for a consumer experience: a ten-second, on-device tongue scan that produces a six-axis taste profile and scores it against a candidate confection, Preview Model #01. We are candid that the link between papillae density and taste sensitivity is contested[5,6,9], and that our scan is a designed experience, not a measurement instrument. Its real job is to help us decide which candy to make, and for whom.
1. Why taste is personal
The receptors for each basic taste sit in their own cells[1]. Variants of a single bitter-receptor gene, TAS2R38, explain most of the difference between people who can and cannot taste the compound PTC[2]. Bartoshuk and colleagues described “supertasters,” who find PROP intensely bitter and tended to have more fungiform papillae[3]; later work showed genotype alone does not explain supertasting[4]. Preference varies too: studies sort people into “sweet likers” and “sweet dislikers,” though methods remain inconsistent[12].
2. Machine vision on the tongue
The Denver Papillae Protocol standardized how papillae are counted from photographs[7]. Eldeghaidy et al. validated automated detection against manual counts in 60 people[8]; Cattaneo et al. trained a neural network on 132 tongue images that tracked manual counts (ρ ≥ 0.76) and produced papillae heat maps[9]; Naciri et al. compared U-Net variants for detection[10]. Convolutional networks have also classified clinical tongue images[11] — medical work we cite for context only.
3. The Super Candy scan
The subject frames their tongue in an on-screen reticle. On the device, we downsample the frame, check that the target zone contains a plausible lingual surface (hue, saturation and luminance bands), and compute a handful of summary features: surface coverage, local-contrast energy (a loose stand-in for papillae texture), luminance and hue offset. Only these numbers leave the phone. A seeded model maps them to six axes — sweet sensitivity, sour tolerance, bitter tolerance, crunch demand, melt preference and a “chaos index” — plus an archetype and a taster class distributed roughly in the proportions reported for non-tasters, tasters and supertasters[3].
4. Formulating Preview Model #01
Flavor is assembled by the brain from taste, smell, texture, sight and sound[14], and mouthfeel depends on how food flows and lubricates, not only on chemistry[13]. Recipe-network studies show ingredients can be paired computationally[15,16]. Preview Model #01 therefore stacks contrasts rather than a single note: three neon taffy layers (sweet berry, sour lime, blue-raz) under a tangy cream coat, over a caramelized crackle shell, finished with sprinkles for visual crunch.
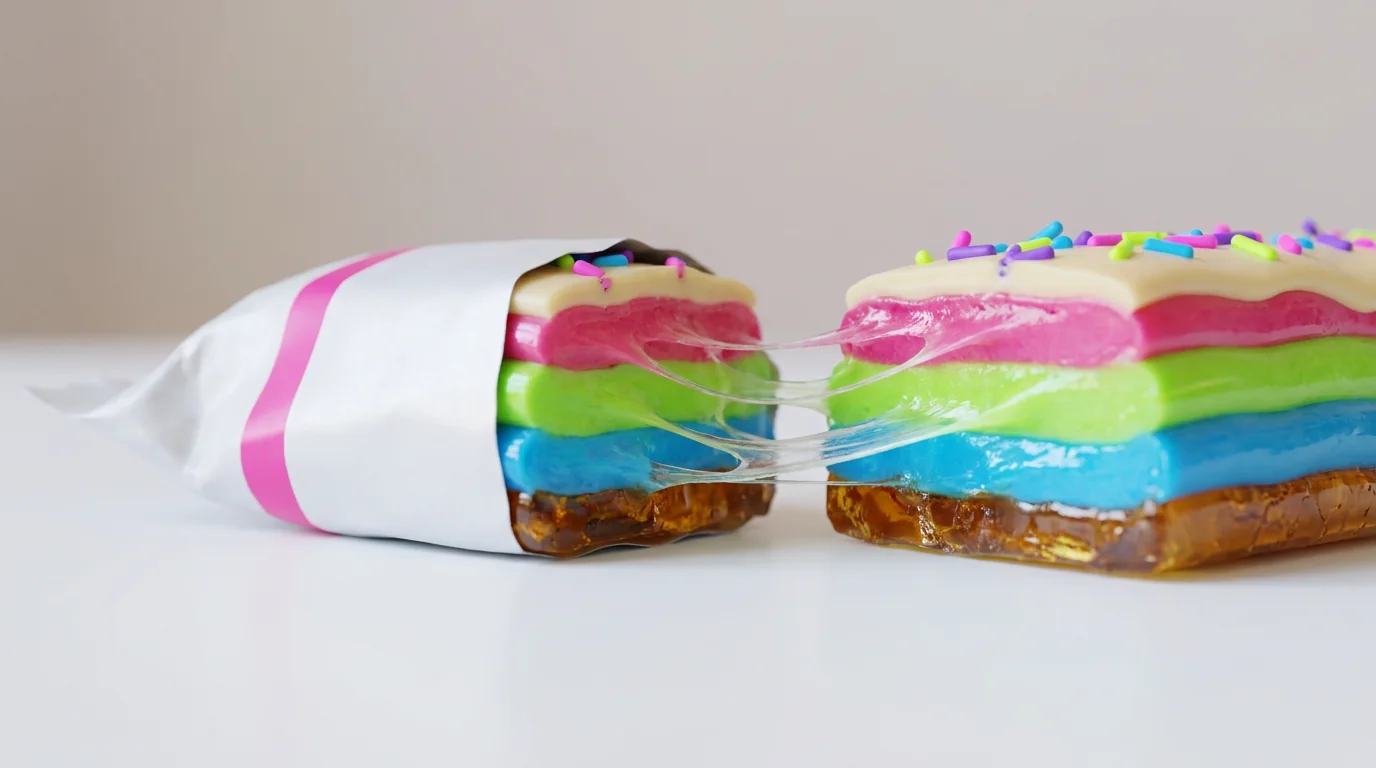
Compatibility is scored against the #01 target profile. Subjects outside range are labeled anomalies, kept (with consent) as candidates for future formulas, and can be re-scored as the dataset grows.
5. Limitations
Large studies found that papillae density did not predict PROP bitterness[5]; in 2,371 adults it varied from 0 to 212 per cm² and was unrelated to taste intensity[6]; and neither manual nor machine counts correlated with PROP bitterness in Cattaneo et al.[9]. Consumer phone photos are far noisier than lab images. For all of these reasons, the profile should be read as entertainment and as a preference signal we use for product design — nothing more.
References
- Chandrashekar, J., Hoon, M. A., Ryba, N. J. P., & Zuker, C. S. (2006). The receptors and cells for mammalian taste. Nature, 444, 288–294. doi:10.1038/nature05401
- Kim, U.-K., Jorgenson, E., Coon, H., Leppert, M., Risch, N., & Drayna, D. (2003). Positional cloning of the human quantitative trait locus underlying taste sensitivity to phenylthiocarbamide. Science, 299, 1221–1225. doi:10.1126/science.1080190
- Bartoshuk, L. M., Duffy, V. B., & Miller, I. J. (1994). PTC/PROP tasting: Anatomy, psychophysics, and sex effects. Physiology & Behavior, 56(6), 1165–1171. doi:10.1016/0031-9384(94)90361-1
- Hayes, J. E., Bartoshuk, L. M., Kidd, J. R., & Duffy, V. B. (2008). Supertasting and PROP bitterness depends on more than the TAS2R38 gene. Chemical Senses, 33(3), 255–265. doi:10.1093/chemse/bjm084
- Garneau, N. L., Nuessle, T. M., Sloan, M. M., Santorico, S. A., Coughlin, B. C., & Hayes, J. E. (2014). Crowdsourcing taste research: Genetic and phenotypic predictors of bitter taste perception as a model. Frontiers in Integrative Neuroscience, 8, 33. doi:10.3389/fnint.2014.00033
- Fischer, M. E., Cruickshanks, K. J., Schubert, C. R., Pinto, A., Klein, R., Pankratz, N., et al. (2013). Factors related to fungiform papillae density: The Beaver Dam Offspring Study. Chemical Senses, 38(8), 669–677. doi:10.1093/chemse/bjt033
- Nuessle, T. M., Garneau, N. L., Sloan, M. M., & Santorico, S. A. (2015). Denver Papillae Protocol for objective analysis of fungiform papillae. Journal of Visualized Experiments, (100), e52860. doi:10.3791/52860
- Eldeghaidy, S., Thomas, D., Skinner, M., Ford, R., Giesbrecht, T., Thomas, A., et al. (2018). An automated method to detect and quantify fungiform papillae in the human tongue: Validation and relationship to phenotypical differences in taste perception. Physiology & Behavior, 184, 226–234. doi:10.1016/j.physbeh.2017.12.003
- Cattaneo, C., Liu, J., Wang, C., Pagliarini, E., Sporring, J., & Bredie, W. L. P. (2020). Comparison of manual and machine learning image processing approaches to determine fungiform papillae on the tongue. Scientific Reports, 10, 18694. doi:10.1038/s41598-020-75678-2
- Naciri, L. C., Cabini, R. F., Melis, M., Crnjar, R., Pizzagalli, D. U., & Tomassini Barbarossa, I. (2025). Automatic detection of fungiform papillae on the human tongue via convolutional neural networks and identification of the best performing model. Computational and Structural Biotechnology Journal, 27, 1927–1934. doi:10.1016/j.csbj.2025.05.014
- Tiryaki, B., Torenek-Agirman, K., Miloglu, O., Korkmaz, B., Ozbek, İ. Y., & Oral, E. A. (2024). Artificial intelligence in tongue diagnosis: Classification of tongue lesions and normal tongue images using deep convolutional neural network. BMC Medical Imaging, 24, 59. doi:10.1186/s12880-024-01234-3
- Iatridi, V., Hayes, J. E., & Yeomans, M. R. (2019). Reconsidering the classification of sweet taste liker phenotypes: A methodological review. Food Quality and Preference, 72, 56–76. doi:10.1016/j.foodqual.2018.09.001
- Stokes, J. R., Boehm, M. W., & Baier, S. K. (2013). Oral processing, texture and mouthfeel: From rheology to tribology and beyond. Current Opinion in Colloid & Interface Science, 18(4), 349–359. doi:10.1016/j.cocis.2013.04.010
- Spence, C. (2015). Multisensory flavor perception. Cell, 161(1), 24–35. doi:10.1016/j.cell.2015.03.007
- Ahn, Y.-Y., Ahnert, S. E., Bagrow, J. P., & Barabási, A.-L. (2011). Flavor network and the principles of food pairing. Scientific Reports, 1, 196. doi:10.1038/srep00196
- Park, D., Kim, K., Kim, S., Spranger, M., & Kang, J. (2021). FlavorGraph: A large-scale food-chemical graph for generating food representations and recommending food pairings. Scientific Reports, 11, 931. doi:10.1038/s41598-020-79422-8
† Super Candy Labs is a candy company. Cited studies are real research on human taste; none of them studied, reviewed or endorse this app. Peer-reviewed by nobody. Taste-tested by everybody.